什么是 Exporter? 理论上所有可以向 Prometheus 提供监控样本数据的程序都可以被称为一个 Exporter。而 Exporter 的一个实例称为 target,Prometheus 通过轮询的方式定时从这些 target 中获取样本数据
Exporter 规范 Exporter 的 Content-Type 必须是 text 类型,如果当前行以# HELP开始,Promtheus 将会对内容进行解析,得到当前的指标名称以及相应的说明信息,如果当前行以# TYPE开始,Prometheus 会对内容进行解析,得到当前的指标名称以及指标类型,TYPE 注释行必须出现在指标的第一个样本之前。如果没有明确的指标类型需要返回为 untyped。 除了# 开头的所有行都会被视为是监控样本数据。
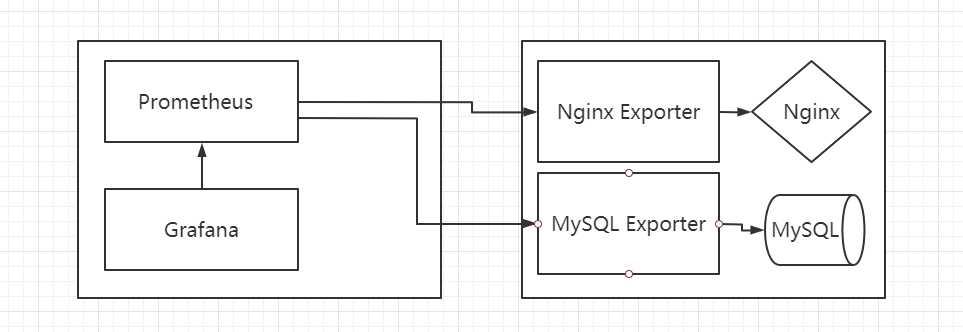
工作流程
数据类型 Prometheus 提供 4 种类型的 Metrics:Counter, Gauge, Summary, Histogram
Counter(计数器类型)
1 2 3 4 5 6 7 8 requests_total = Counter("requests_total" , "总请求次数" ) @app.route("/metrics" def requests_count (): requests_total.inc() return Response(prometheus_client.generate_latest(requests_total), mimetype="text/plain" )
上面示例将会在 web 页面返回如下内容,并且请求次数会随着页面刷新递增
1 2 3 4 5 6 # HELP requests_total 总请求次数 # TYPE requests_total counter requests_total 5.0 # HELP requests_created 总请求次数 # TYPE requests_created gauge requests_created 1.6002211412159185e+09
Counter 类型数据可以让用户方便的了解事件产生的速率的变化,在 PromQL 内置的相关操作函数可以提供相应的分析,比如以 HTTP 应用请求量来进行说明
1 2 3 4 rate(http_requests_total[5m]) topk(10 , http_requests_total)
Gauge(仪表盘类型)
1 2 3 4 dalta(cpu_temp_celsius{host="zeus" }[2h]) predict_linear(node_filesystem_free{job="node" }[1h], 4 *3600 )
1
2
3
4
5
6
7
8
requests_total = Gauge("request_count" , "测试Gauge类型" ) @app.route("/metrics" def requests_count (): requests_total.set (5 ) return Response(prometheus_client.generate_latest(requests_total),mimetype="text/plain" )
以上示例访问 Web 将会返回如下内容,无论怎么刷新,值都会是 5.0
1 2 3 # HELP request_count 测试Gauge类型 # TYPE request_count gauge request_count 5.0
Histogram(直方图类型)
1 2 3 io_namespace_http_requests_latency_seconds_histogram_count{path="/" ,method="GET" ,code="200" ,} 2.0
1 2 3 io_namespace_http_requests_latency_seconds_histogram_sum{path="/" ,method="GET" ,code="200" ,} 13.107670803000001
Summary(摘要类型)
Summary 与 Histogram 相比区别如下
都包含 < basename>_sum 和< basename>_count;
Histogram 需要通过< basename>_bucket 计算 quantile,而 Summary 直接存储了 quantile 的值。
序号
histogram
Summary
配置
区间配置
分位数和滑动窗口
客户端性能
只需增加 counters 代价小
需要流式计算代价高
服务端性能
计算分位数消耗大,可能会耗时
无需计算,代价小
时序数量
sum、_count、bucket
_sum、_count、quantile
分位数误差
bucket 的大小有关
φ 的配置有关
φ 和滑动窗口
Prometheus 表达式设置
客户端设置
聚合
根据表达式聚合
一般不可聚合
1 2 3 io_namespace_http_requests_latency_seconds_summary_count{path="/" ,method="GET" ,code="200" ,} 12.0
1 2 3 io_namespace_http_requests_latency_seconds_summary_sum{path="/" ,method="GET" ,code="200" ,} 51.029495508
1 2 3 4 5 io_namespace_http_requests_latency_seconds_summary{path="/" ,method="GET" ,code="200" ,quantile="0.5" ,} 3.052404983 io_namespace_http_requests_latency_seconds_summary{path="/" ,method="GET" ,code="200" ,quantile="0.9" ,} 8.003261666
示例 使用 labels,可以一次加多组值,同一组值 labels 不能完全一致
1 2 3 4 5 6 7 8 9 10 11 app = Flask(__name__) port_up = Gauge("server_port" , "monitor server port status." ,["host" ,"port" ]) @app.route("/metrics" def metrics (): port_up.labels("192.168.1.1" , "22" ).set (0 ) port_up.labels("192.168.1.2" , "22" ).set (0 ) port_up.labels("192.168.1.3" , "22" ).set (1 ) return Response(prometheus_client.generate_latest(port_up), mimetype="text/plain" )
上面的示例将会返回如下值
1 2 3 4 5 # HELP server_port monitor server port status. # TYPE server_port gauge server_port{host="192.168.1.1",port="22"} 0.0 server_port{host="192.168.1.2",port="22"} 0.0 server_port{host="192.168.1.3",port="22"} 1.0
但是这样写,labels 需要做一些操作才能一次请求获取到多项变量,正确的方法应该是使用 CollectorRegistry,CollectorRegistry 可以同时注册多个自定义指标并返回给 prometheus
1 2 3 REGISTRY = CollectorRegistry(auto_describe=False )
完整示例 1 2 3 4 5 6 7 8 9 10 11 12 13 14 15 16 17 18 19 20 21 22 23 24 25 26 27 28 29 30 31 32 33 34 35 36 37 38 39 40 41 42 43 44 45 46 47 48 49 50 51 52 53 54 55 56 57 58 59 60 61 62 63 64 65 66 67 68 69 70 71 72 73 74 import prometheus_clientfrom prometheus_client import Gaugefrom prometheus_client.core import CollectorRegistryfrom flask import Response, Flaskfrom nmap import nmapfrom flask_apscheduler import APSchedulerfrom psutil import virtual_memoryfrom psutil import cpu_timesapp = Flask(__name__) scan_data = [] def scan_port (): host_list = ['192.168.80.100' , '192.168.80.101' , '192.168.80.102' , '192.168.80.103' , '192.168.80.104' , '192.168.10.11' ] for i in host_list: nm = nmap.PortScanner() port = '22' nm.scan(i, port) name = nm[i]['tcp' ][int (port)]['name' ] port_state = nm[i]['tcp' ][int (port)]['state' ] version = nm[i]['tcp' ][int (port)]['version' ] scan_data.append({'host' : i, 'port' : port, 'port_state' : port_state, 'name' : name, 'version' : version}) class SchedulerConfig (object ): JOBS = [ { 'id' : 'update_job' , 'func' : '__main__:update_job' , 'args' : None , 'trigger' : 'interval' , 'seconds' : 10 , } ] def update_job (): scan_port() print ("数据更新完成" ) app.config.from_object(SchedulerConfig()) REGISTRY = CollectorRegistry(auto_describe=False ) host_info = Gauge("host_info" , "主机信息扫描" , ["host" , "port" , "port_state" , "name" , "version" ], registry=REGISTRY) mem_percent = Gauge("system_memory_percent" , "内存使用率" , registry=REGISTRY) cpu_percent = Gauge("system_cpu_percent" , "CPU使用率" , registry=REGISTRY) @app.route("/metrics" def metrics (): mem_percent.set (virtual_memory().percent) cpu_percent.set (cpu_times().system) for i in scan_data: host = i.get('host' ) port = i.get('port' ) port_state = i.get('port_state' ) name = i.get('name' ) version = i.get('version' ) host_info.labels(host, port, port_state, name, version) return Response(prometheus_client.generate_latest(REGISTRY), mimetype="text/plain" ) if __name__ == "__main__" : scheduler = APScheduler() scheduler.init_app(app) scheduler.start() app.run(host="0.0.0.0" , port=8000 , debug=True , use_reloader=False )
返回值 1 2 3 4 5 6 7 8 9 10 11 12 13 14 # HELP host_info 主机信息扫描 # TYPE host_info gauge host_info{host="192.168.80.100",name="ssh",port="22",port_state="open",version="7.6p1 Ubuntu 4ubuntu0.3"} 0.0 host_info{host="192.168.80.101",name="ssh",port="22",port_state="open",version="7.6p1 Ubuntu 4ubuntu0.3"} 0.0 host_info{host="192.168.80.102",name="ssh",port="22",port_state="open",version="7.4"} 0.0 host_info{host="192.168.80.103",name="ssh",port="22",port_state="open",version="7.4"} 0.0 host_info{host="192.168.80.104",name="ssh",port="22",port_state="open",version="7.4"} 0.0 host_info{host="192.168.10.11",name="ssh",port="22",port_state="closed",version=""} 0.0 # HELP system_memory_percent 内存使用率 # TYPE system_memory_percent gauge system_memory_percent 83.2 # HELP system_cpu_percent CPU使用率 # TYPE system_cpu_percent gauge system_cpu_percent 3456.140625